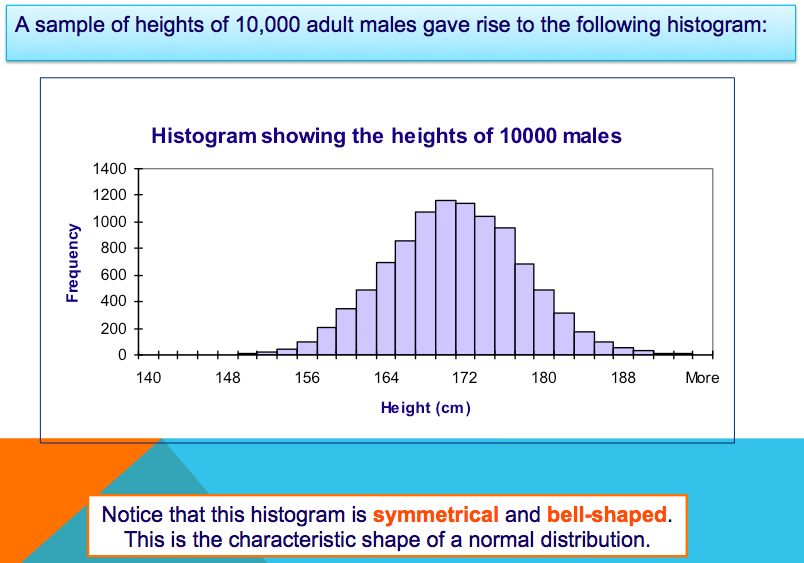
If you now draw a line through all the midpoints on this histogram, you will have a line the shape of a bell. This shape is called the normal curve.
The normal distribution is an appropriate model for many common continuous distributions such as:
- the masses of newborn babies
- people's IQ scores
- the hand span of adult females
- the heights of redwoods in a temperate forest
The normal distribution is an appropriate model for many common continuous distributions such as:
- the masses of newborn babies
- people's IQ scores
- the hand span of adult females
- the heights of redwoods in a temperate forest
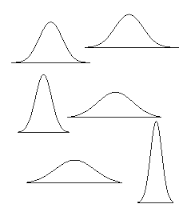
All normal curves are symmetrical and bell-shaped but the exact shape depends on two parameters: the mean and the standard deviation. The mean is the middle of the normal curve (hence it is 0 SD away from the mean) and either sides of the mean increase/decrease by one SD as the curve moves away from the middle.
properties of the normal distribution
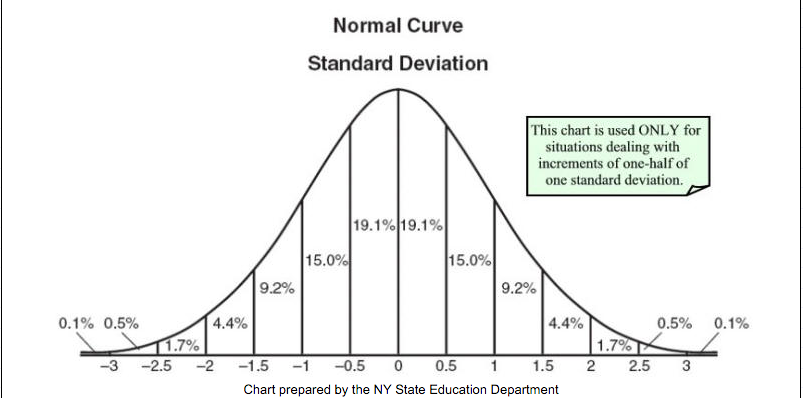
The area under the normal distribution curve is the sum of all probabilities. So the total area under the curve is 1 or 100%. The curve is symmetrical so the area to the right of the mean and the area to the left of the mean are both 0.5 (or 50%).
|
The shape of the curve or level of "flatness" depends on the value of the SD. If the SD is small, the curve will be very narrow but as the SD gets bigger the curve flattens out.
|
|

|
|
|
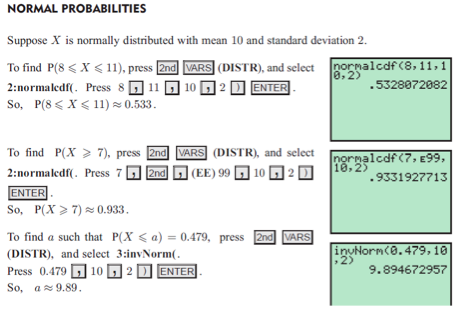
Using the ti-84 (Older version) with the normal distribution
If you have a casio:
If you want to calculate probability under the curve by hand...
Inverse Normal distribution
An inverse normal distribution is a way to work backwards from a known probability to find an x-value.
Below are two tutorials demonstrating problems involving inverse normal distribution, on the left using a TI-84 and on the right using a Casio:
Below are two tutorials demonstrating problems involving inverse normal distribution, on the left using a TI-84 and on the right using a Casio:
|
|
|
