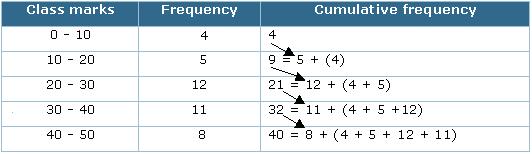
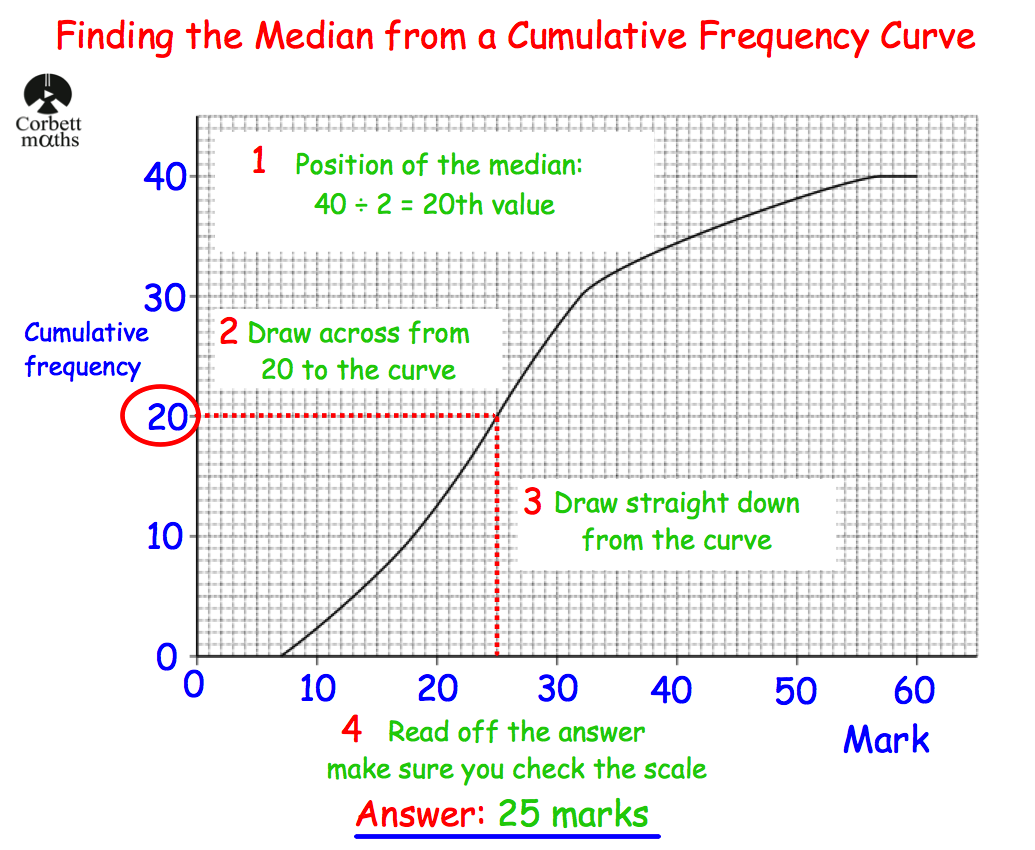
Cumulative Frequency and quartiles
|
|
|
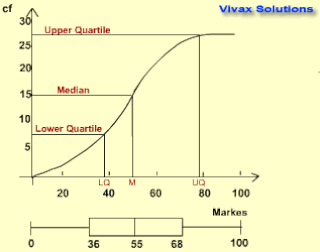
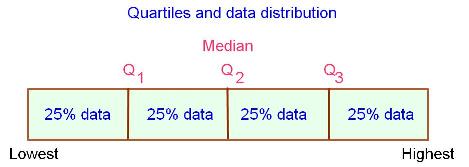
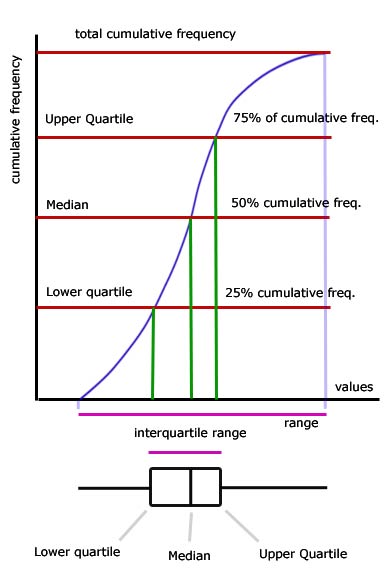
Quartiles are values that divide a list of numbers into quarters. The first quartile, Q1, is defined as the middle number between the min and the median of the data set. The second quartile, Q2, is essentially the median of the data set. The third quartile, Q3, is the middle value between the median and the max value of the data set.
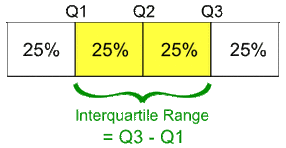
To find the Interquartile Range (IQR), calculate the difference between Q1 and Q3. The IQR is a measure of variability in the data set and is useful because it ignores extreme values. |
practice:
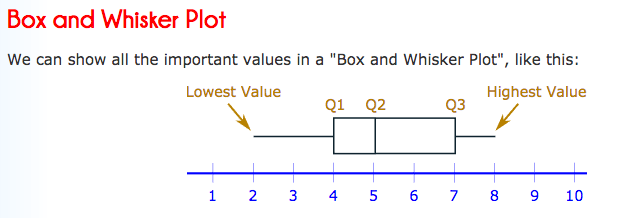
The 5-number summary
|
|
|
|
On a TI-84
|
On a Casio
|
Variance and Standard deviation
The basic measure of how data is spread or dispersed are:
- range
- interquartile range (IQR)
- variance
- standard deviation (SD)
The range of the data set is the highest value minus the lowest value.
The IQR is the difference between the third and the first quartile.
The variance of a data set is the average distance the square of each data value is from the mean.
The standard deviation is defined as the square root of the variance. It's a number that tells you how far from the mean a data value is, with respect to how far the other data values are from the mean.
You can find the SD of a data set by using a process called first principles:
- find the mean of the data
- subtract the mean from each data value (the distance between each data value and the mean)
- square the differences (exaggerates the distances the data are from the mean)
- find the mean average of the squares -> this is called the variance
- take the square root of the variance -> this is the standard deviation
(Excerpt from Mathematical Studies 2nd Edition, Pearson Baccalaureate)
|
|
|
